Americans reported ~$21B in losses to the FBI’s Internet Crime Complaint Center (IC3) in 2025, up roughly 26% year over year and 5 times the 2020 figure. For the same year, the Federal Trade Commission (FTC) recorded ~$16B in losses at a 27% increase compared to 2024.
Most reporting published in 2026 covers data from 2025, which makes up the first portion of this report. The second half covers available data reported in 2026 by law enforcement agencies and threat intelligence organizations.
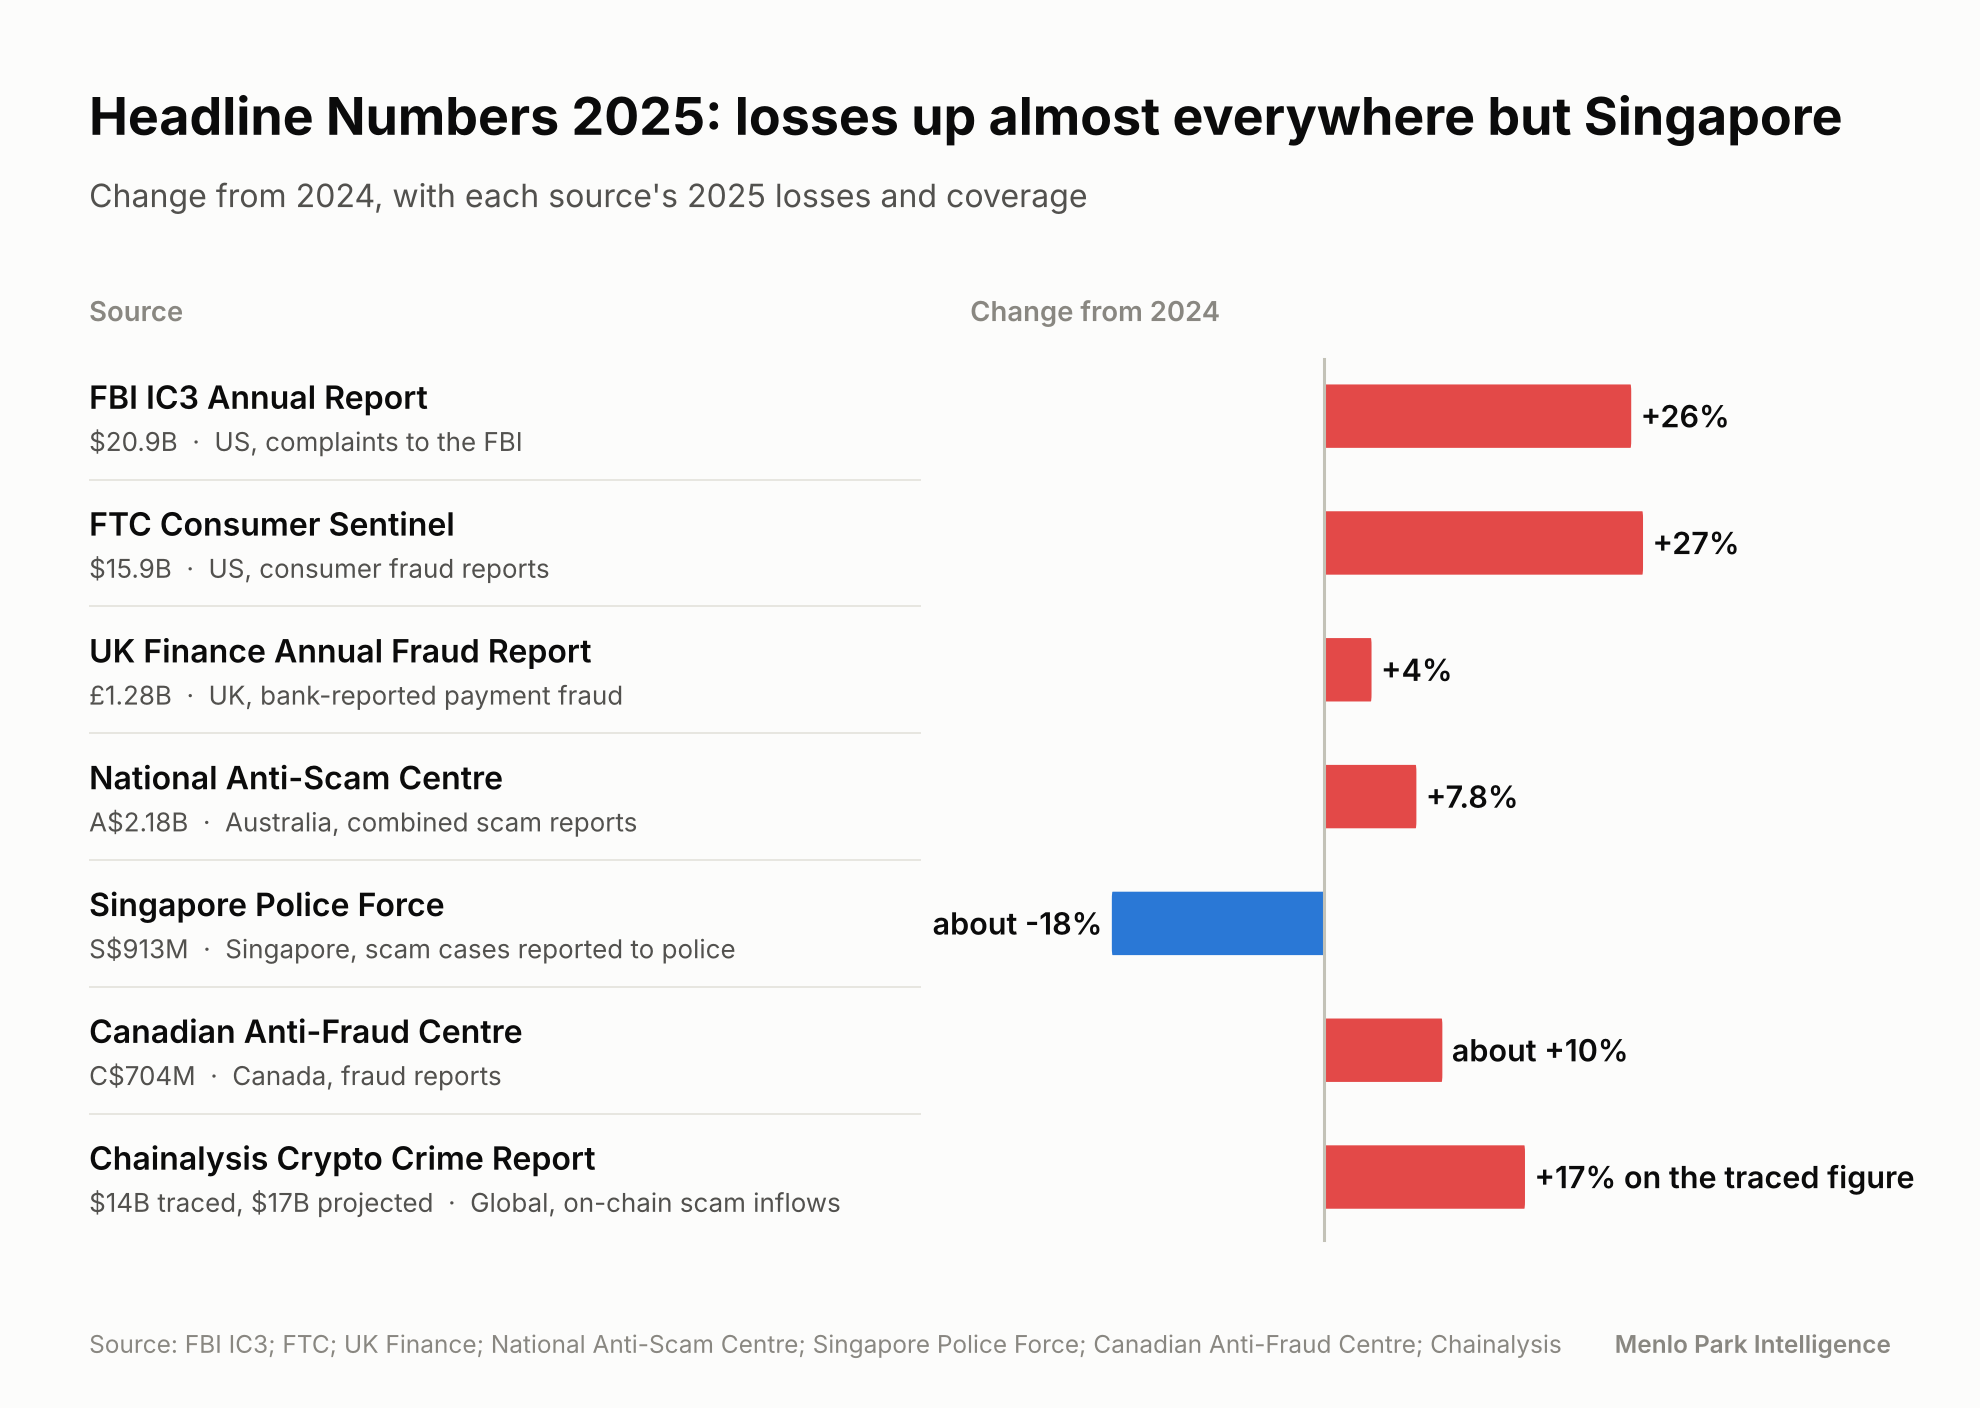
Open chart at full resolution.
As with all loss reporting, the results indicate the floor rather than a holistic view given gaps in victim reporting. In 2024, the FTC’s estimate for a true loss number accounting for underreporting was ~$196B.
Channel Types & Distribution
Investment constitute the largest category in nearly every dataset, accounting for 41% of IC3 losses, roughly 50% of FTC & Canadian losses, and ~38% in Australia & Singapore. In the UK it rose 40% to £221.5 million, the highest on record.
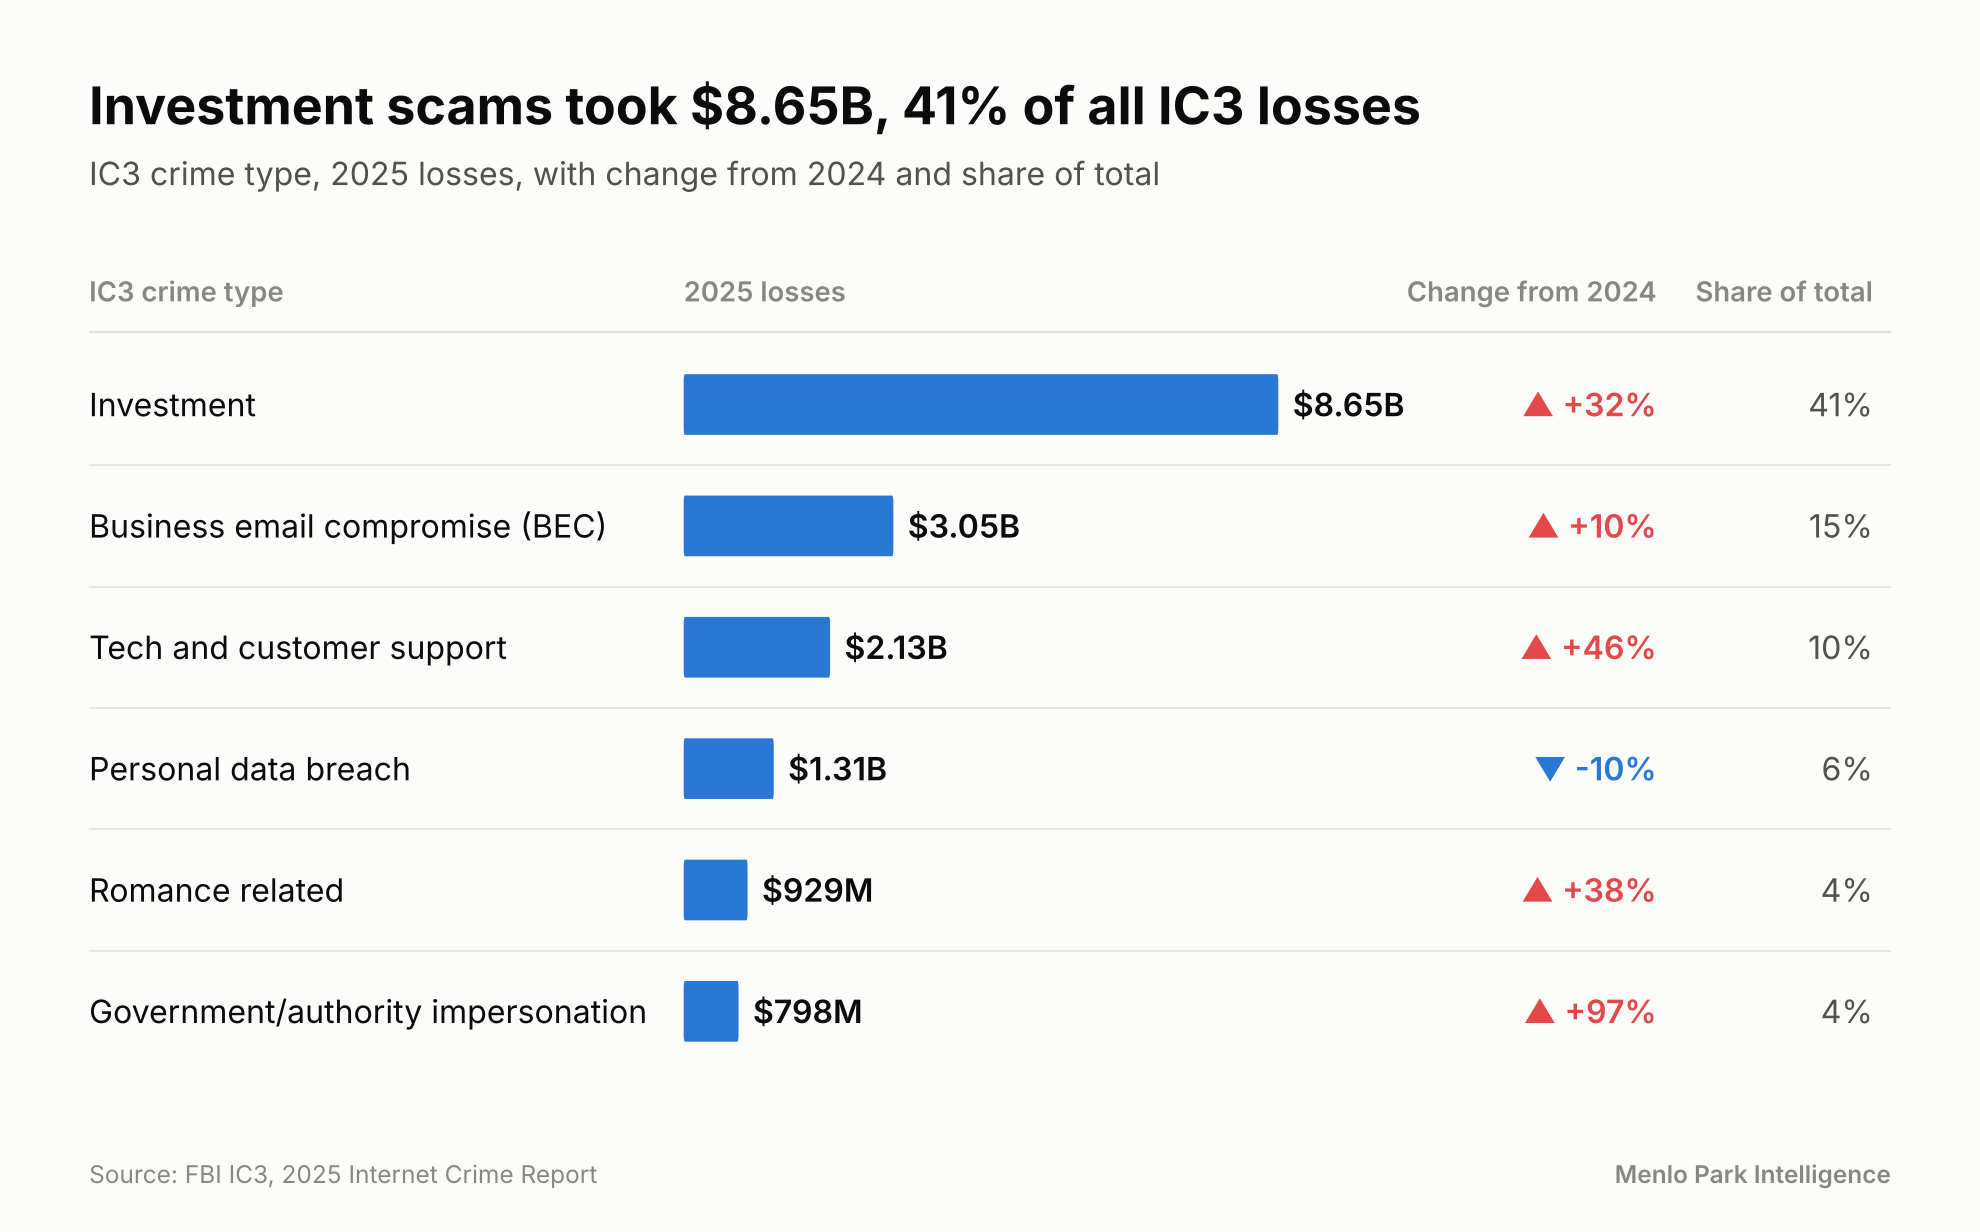
Open chart at full resolution.
Addressing a couple categorical discrepancies, IC3 logged only $32M in ransomware losses, but the figure excluded downtime and recovery costs. Verizon’s 2026 flagship data breach report identified ransomware in 48% of breaches, up from 44% in 2025 with 69% of victims refusing to pay with a median surrendered payment of $139,875. In the corporate realm, 74% of US organizations were hit by BEC according to the Association for Financial Professionals.
Notable Trends
-
Direct targeting of human vulnerabilities in the attack chain: UK unauthorized fraud fell 5% to £703 million while authorized push payment (APP) fraud rose 19% to £576 million, to represent 45% of the total metric. Scams in which the victim paid a correctly identified but fraudulent party rose 35% while constituting 76% of APP losses. In Singapore, victims conducted the transfer themselves in more than 80% of cases in 2025.
-
Crypto as the primary payment rail: Victim scam complaints with a crypto nexus account for $11.4B, or 54% of IC3 losses, and losses through crypto ATM’s rose 58% to $389M. Chainalysis puts the average scam payment at $2,764, up from $782 the prior year.
-
Overrepresentation of older & elderly populations: Americans aged 60 and over collectively lost over $7B, up 59% from the previous year and 37% of the IC3 loss volume overall. There were more than 12,000 reported losses at least in the six figures, which the FTC holds as the primary driver for 6 consecutive years of loss increases.
-
Emerging observation of AI although limited: IC3’s first AI section outlines 22,364 complaints totalling $893M, approximately 4% of losses of which 71% were labeled as investment scams.
-
A scattered tide of rising losses: Although the primary narrative does highlight an overall trend of steadily elevated losses, the reports do show a decrease in some countries and scam types. For example, Singapore reported an 18% drop in 2025, and Australia’s 2025 total is still 30% below its peak in 2022. In the UK, impersonation and invoice redirection scams are at their lowest since 2020.
2026 So Far
While much of the reporting still lags to 2025, early 2026 reporting shows losses flat or moderately falling in Asia Pacific and within baseline levels in Canada. Primary US and UK loss numbers have not yet been released.
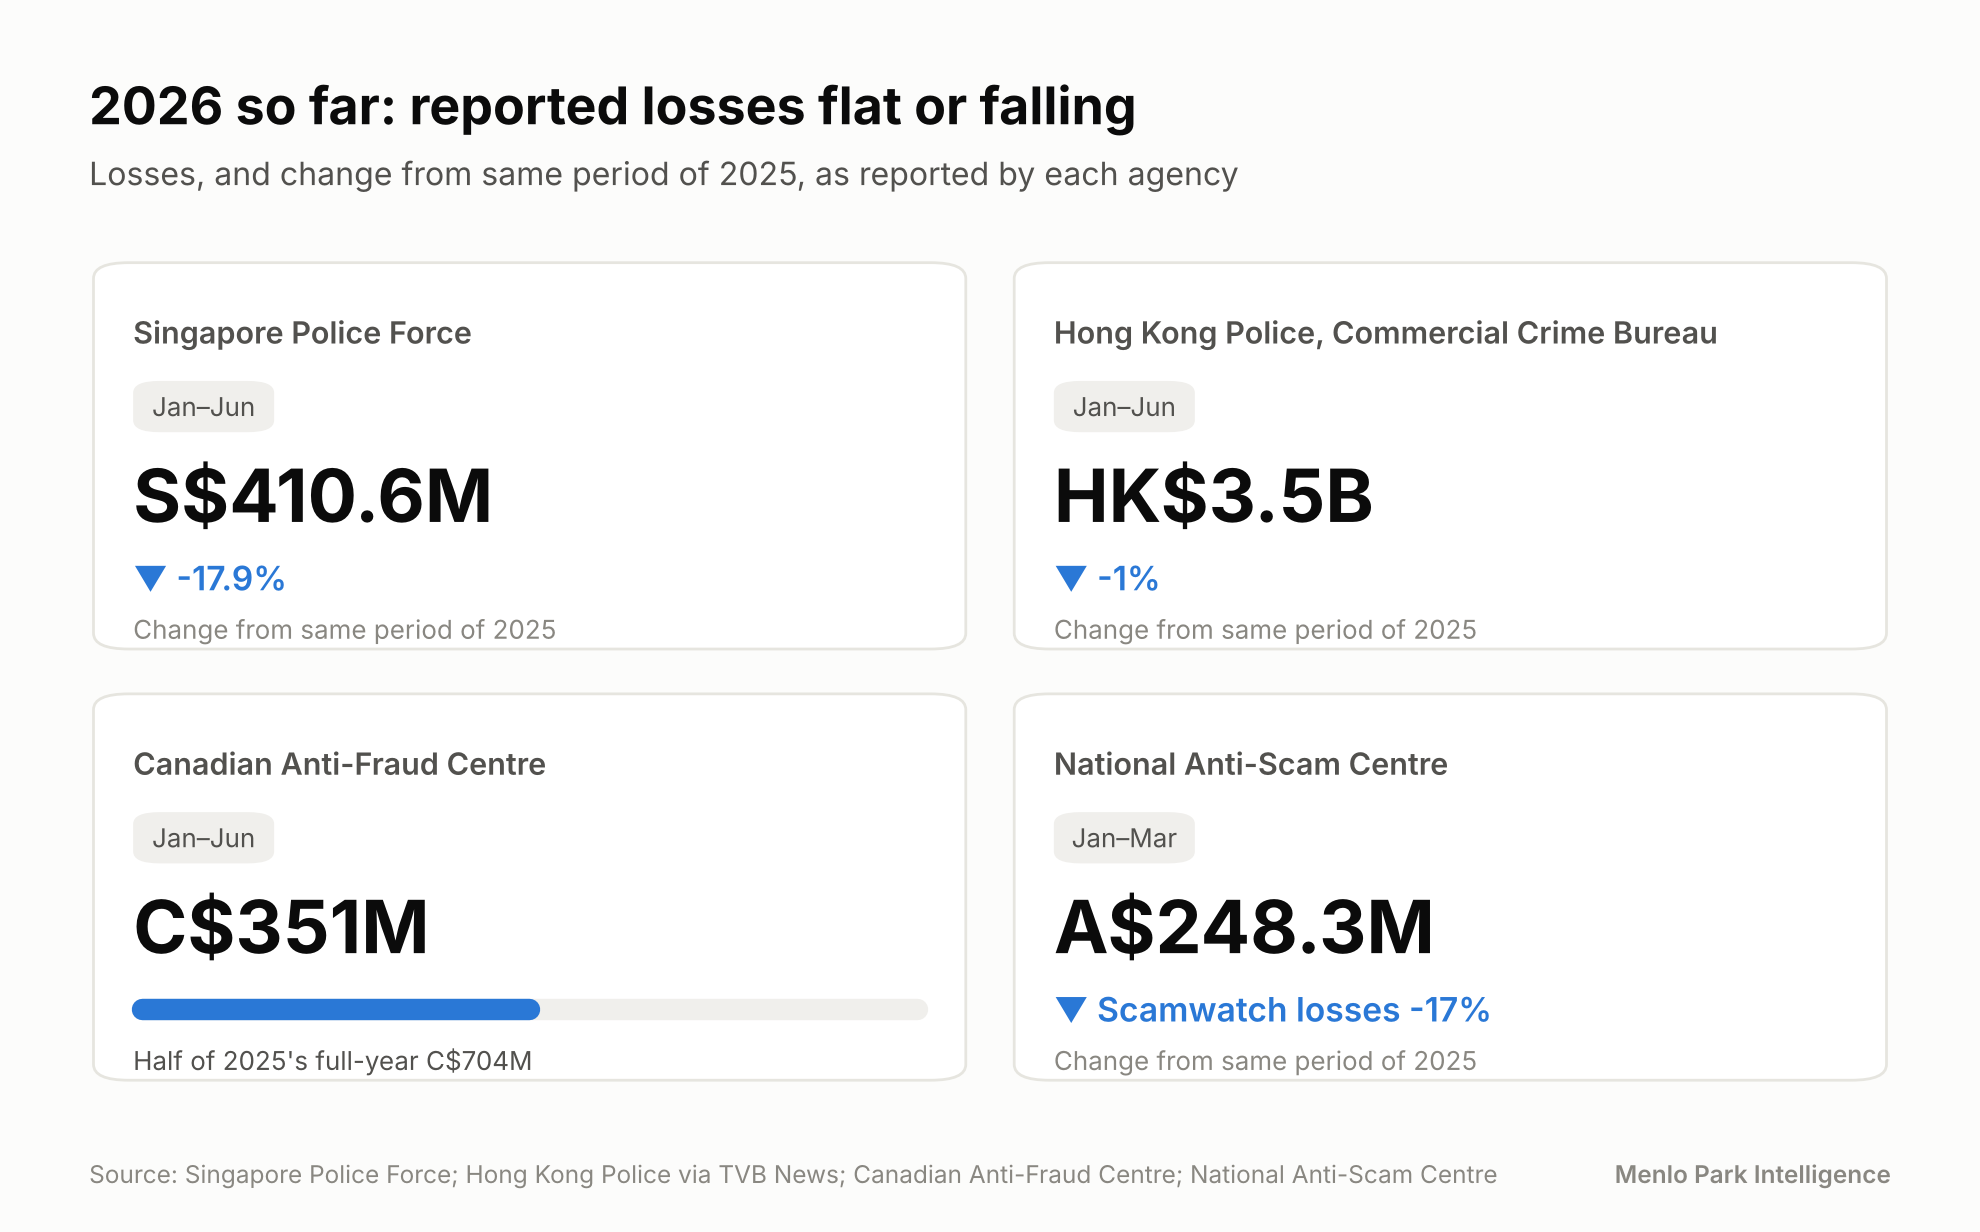
Open chart at full resolution.
Notable in-vertical movers
-
Investment-based scams continue as the largest loss driver, leading all categories in Singapore (169.8M), Canada (139.6M), and Australia’s Scamwatch (45.5M). Hong Kong reported 1.66B, nearly half of all recorded losses.
-
BEC is rising in Singapore; even as total losses fell, BEC-driven losses nearly tripled to 57.3M thus far in 2026. Interestingly, however, crypto losses have dropped 43% to 65.5M.
-
Extortion is rising in Canada; losses reported in the first half of 2026 (25.5M) already exceed the gross number reported for all of 2025 (23M).
-
Identity-based fraud is rising in the UK; although official government sources haven’t released 2026 numbers yet, Cifas recorded more than half of all fraud cases as identity-based. Retail specific rose 84%.
Auxiliary industry reports highlight different trends
While vendor and consumer survey reporting does not directly measure losses, they do capture more granular snapshots of the fraud landscape, including cost to business and specific attack typologies. For example, BioCatch saw banking scam attempts rise 35% in a year across more than 370 institutions in 21 countries. 90% of those attempts occurred on mobile, and investment scams averaged ~$6.6K per case. Reverberation effects are also present, with LexisNexis slating the total cost at $5.13 per $1 of direct fraud loss for US retail and ecommerce businesses, up from about $2.40 in 2016. Survey data from Experian support the trends observed in quantitative reporting; 60% of businesses stated an increase in fraud losses, and 19% of all consumers reported financial loss due to online scams. However, the landscape of scam exposure is near universal, as the Global Anti-Scam Alliance’s (GASA) survey found that 82% of US adults had encountered a scam in the past year.
It is worth noting for this analysis, much of the industry reporting covers different metrics entirely, and thus it is crucial to synthesize various quantitative reports for a qualitatively sensible snapshot. For example, while the IC3 and FTC count victim complaints, the UK finance & banking body counts instances of bank reported fraud, and Chainalysis counts inflows to digital wallets it identifies as scams. Additionally, the true picture of scam financial impact is clouded given the vast level of underreporting; the FTC cites 2021 research estimating only 4.8% of mass market fraud victims file an official complaint to a government body or the Better Business Bureau. Canada’s equivalent lodges similar estimates at 5 - 10%. There is also a sizable disparity between national reports, with GASA reporting $442B in scam losses compared to Nasdaq Verafin’s $62B out of a total fraud loss number of $579.4B.
Sources
-
FBI IC3, 2025 Internet Crime Report (April 2026)
-
FTC, prepared statement to the Joint Economic Committee (25 March 2026)
-
UK Finance, Annual Fraud Report 2026 (June 2026)
-
Verizon, 2026 Data Breach Investigations Report, executive summary (May 2026)
-
Chainalysis, 2026 Crypto Crime Report: Scams (January 2026)
-
Association for Financial Professionals, 2026 Payments Fraud and Control Survey release (April 2026)
-
Canadian Anti-Fraud Centre, Top 10 frauds in 2025 and Fraud trends, first six months of 2026
-
National Anti-Scam Centre, Targeting Scams Report 2025 release (March 2026)
-
Singapore Police Force, Annual Scam and Cybercrime Brief 2025 and Mid-Year Brief 2026
-
Feedzai on the GASA Global State of Scams 2025 report (October 2025)
-
BioCatch, 2026 Global Scams report release (30 September 2026)
-
LexisNexis Risk Solutions, 2026 True Cost of Fraud Study release (June 2026)
-
Experian, 2026 U.S. Identity and Fraud Report (August 2026)
-
Global Anti-Scam Alliance, State of Scams USA 2026 (June 2026)
-
Hong Kong Police figures via TVB News and The Standard (August 2026)
-
National Anti-Scam Centre, Q1 2026 release (June 2026)
-
Cifas, Fraudscape 2026 six-month update (August 2026)